Psychologist Albert Mehrabian demonstrated that 93% of communication is nonverbal. As per 3M Corporation, we process visuals 60,000 times faster than text.
Matadata
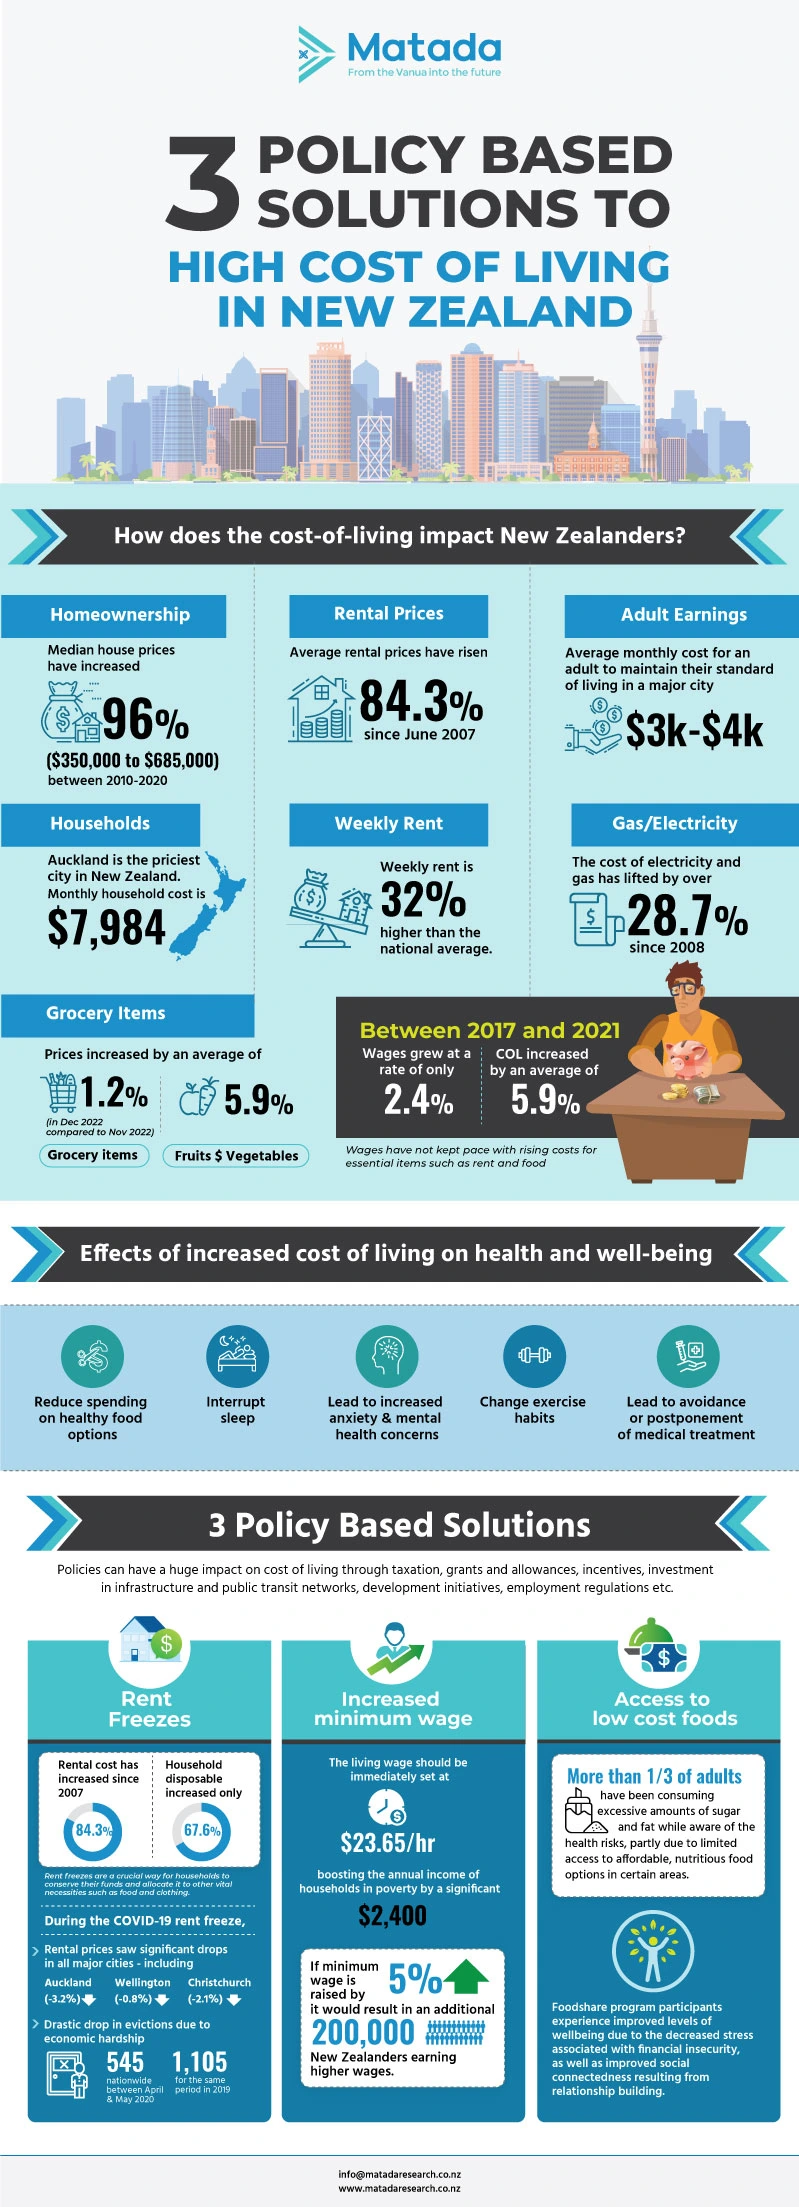
Matadata Research Group (MRG) Ltd. is a social enterprise specializing in transformative research, consultation, and program development to positively impact legislation, policy, and practices to help improve Pacific people’s health and well-being in New Zealand.
I crafted static infographics for Matadata on various subjects like Innovative policy solutions to personal debt, debt forgiveness, 3 policy based solutions to high cost of living in New Zealand, minimum wage increase, analysis of rent freezes.
Starting with the client’s initial document of text and numbers in bullet points, I thoroughly researched their website and business, then transformed the data into visually engaging statistics and percentages, enhanced with relevant and impactful iconography.


HaloAi
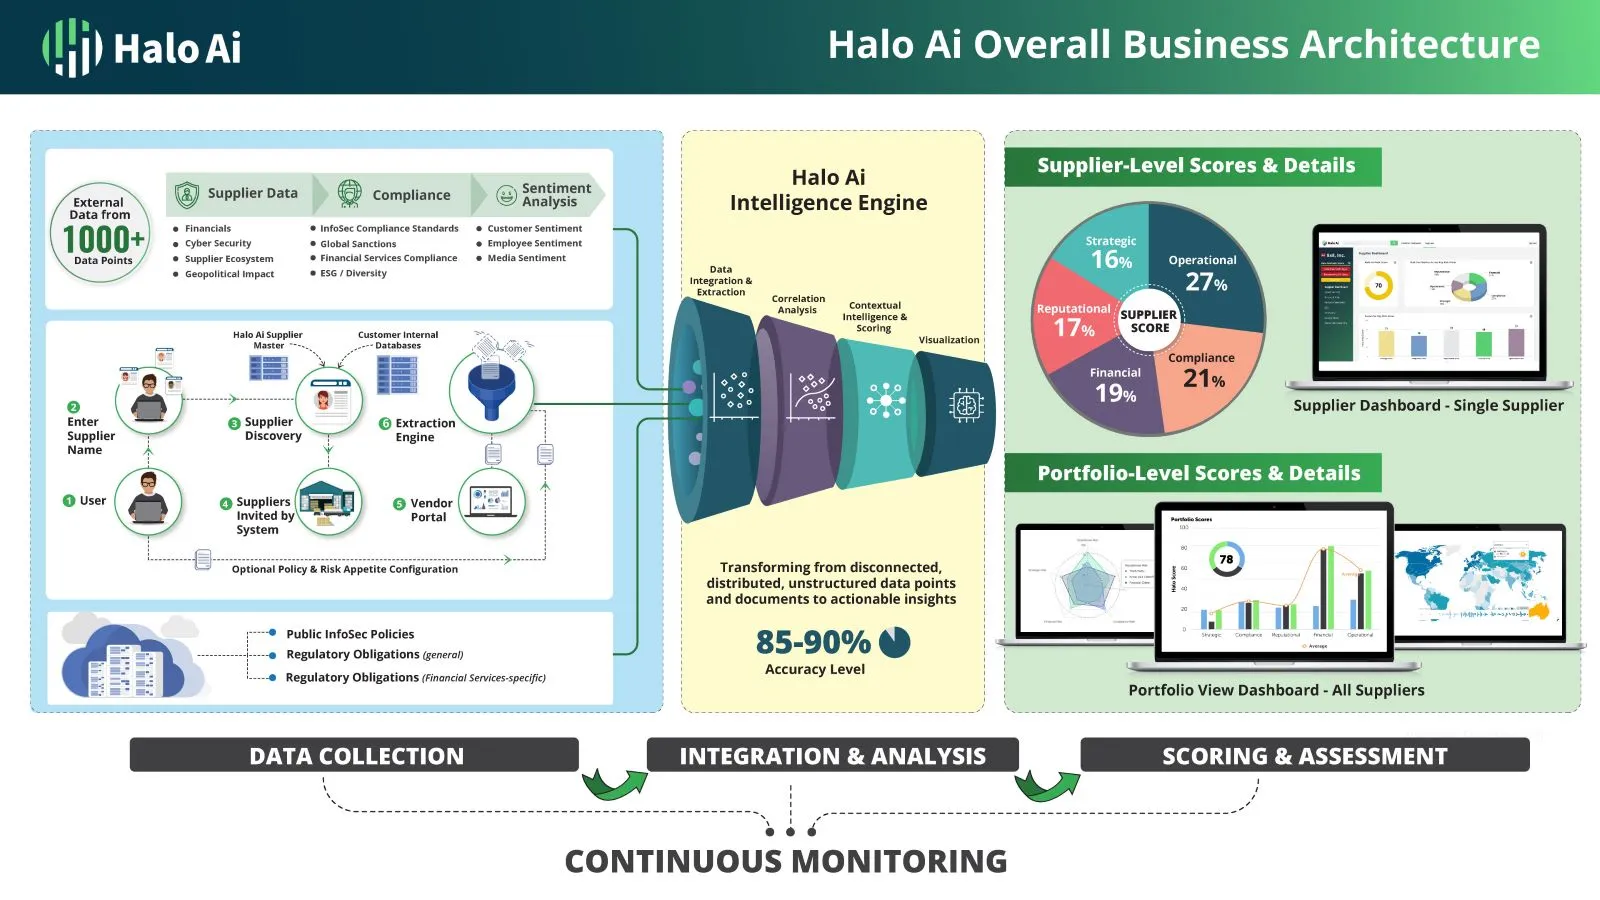
Halo AI offers holistic third-party risk and compliance monitoring across all key domains, powered by real-time, AI-driven insights, accelerate growth effectively through a holistic, yet targeted, approach.
The goal of the infographic was to visually represent Halo AI’s business architecture and AI engine, and how the platform integrates various third-party risk and compliance monitoring tools across key domains such as finance, legal, and cybersecurity.

Ticket Manager
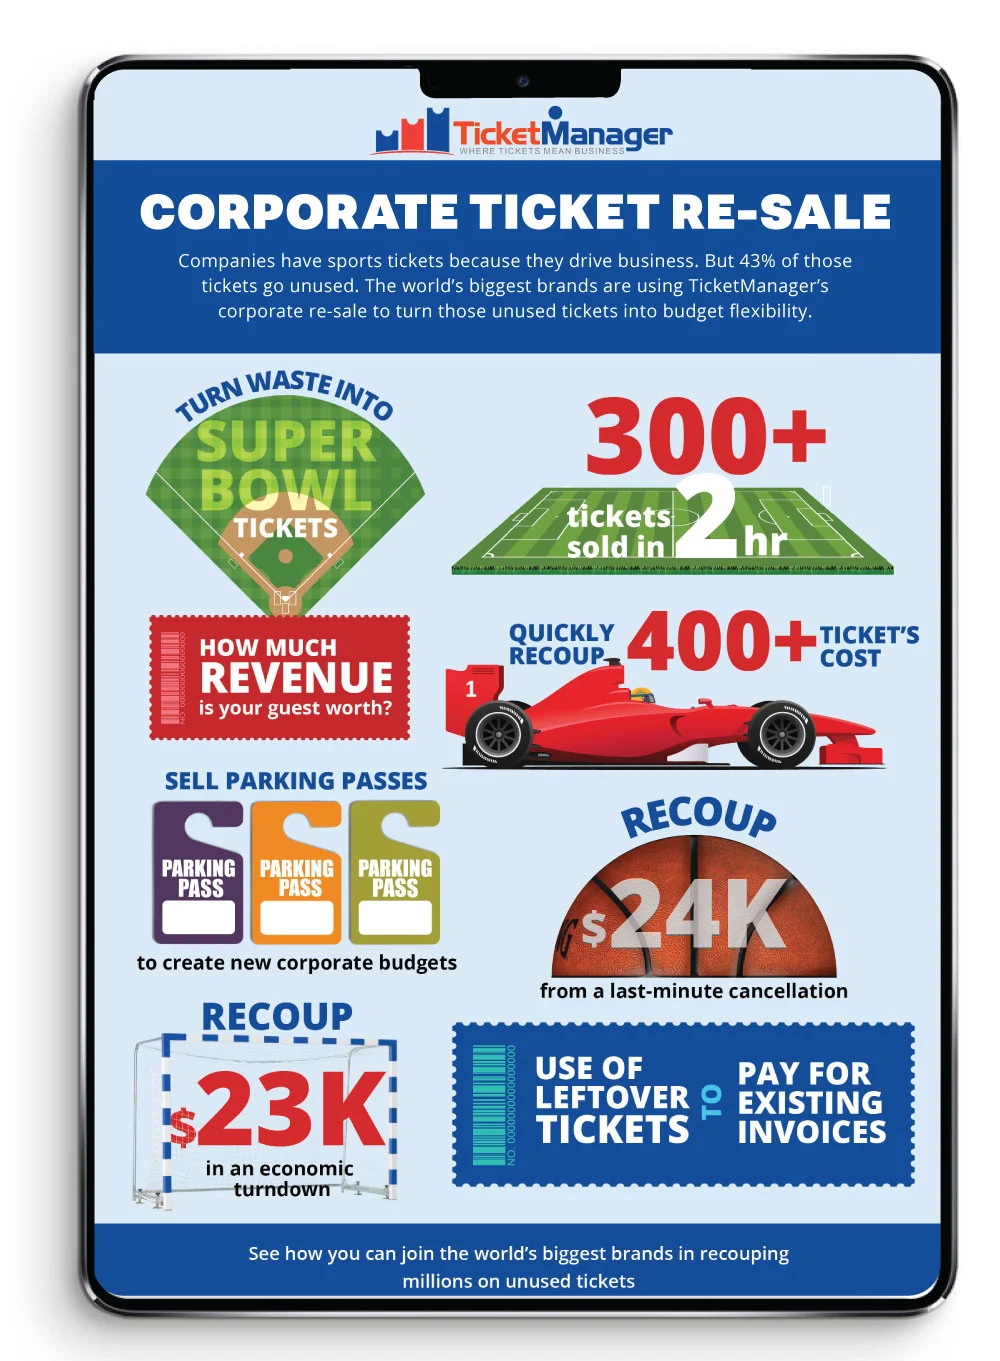
Companies spend $600 billion on event tickets every year, but they struggle to actually put those tickets to good use. Spreadsheets and email just can’t handle the complexity of live event tickets. TicketManager gives them everything they need to manage, allocate, and analyze tickets and events.
The goal of the infographic was to clearly convey key statistics and important points from the client’s document in a visually compelling manner and to highlight specific keywords, numbers, and scores.

Peak Vitality Solutions
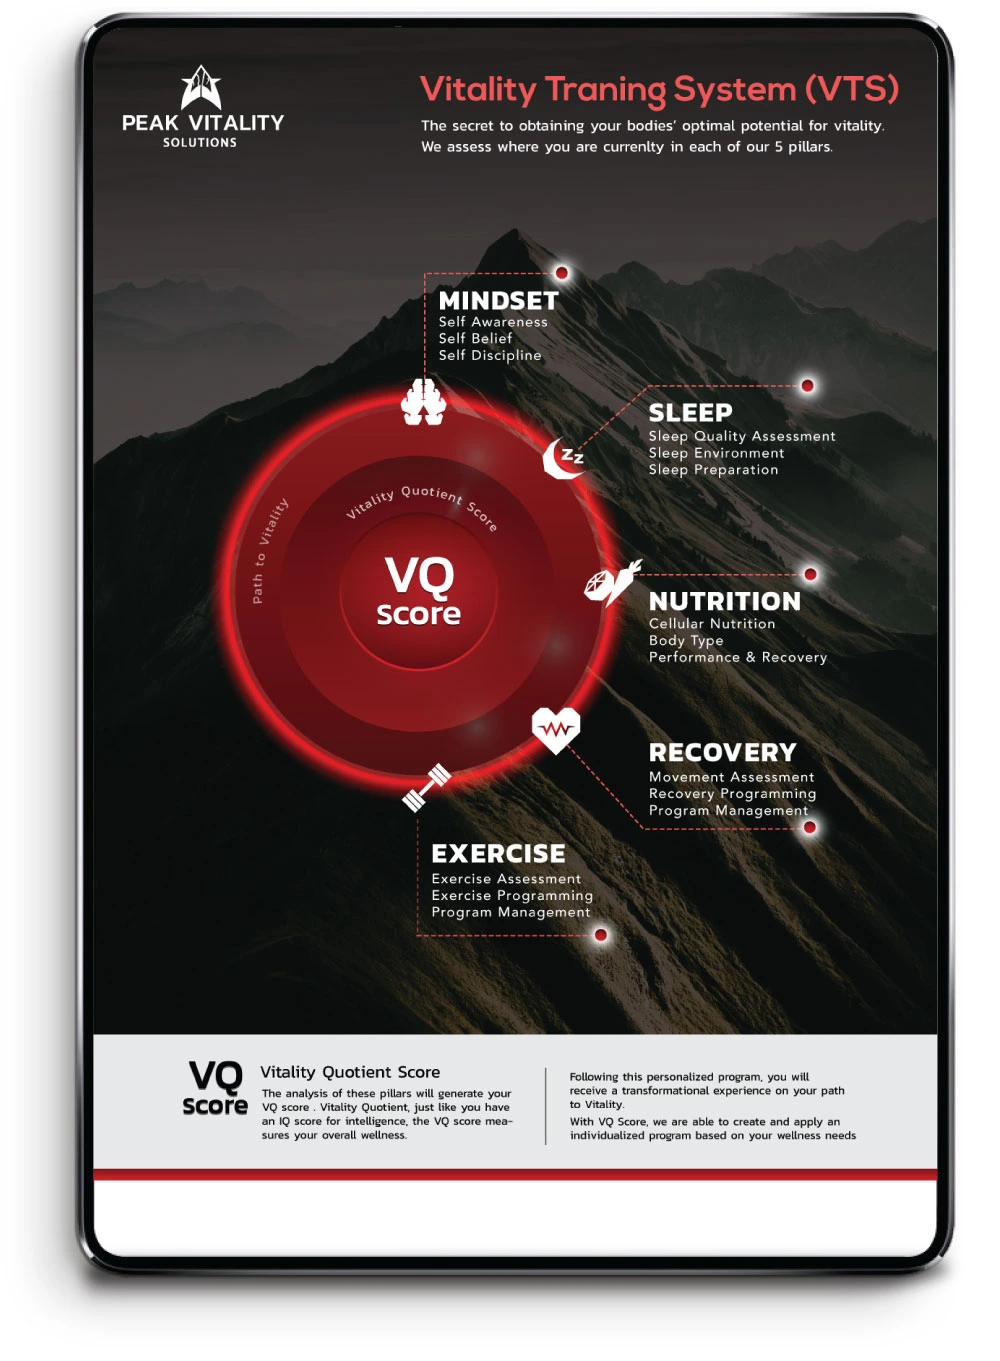
Peak Vitality Solutions guides people in discovering their peak vitality and awaken their inner power to thrive. It aims to deliver science-backed, technology-based wellness solutions that provide transformational results that last for generations to come.
The goal of the infographic was to showcase and highlight their 5 interdependent pillars visually that are essential for overall wellness, transformation, and Vitality in simple and intuitive way.

refuelagency
For more than three decades, refuelagency has been the premier provider of Media + Marketing services, catering to brands and agencies aiming to connect with specific target demographics across the United States, effectively reaching military, teen, college, and multicultural consumers.
To design an infographic for military consumers on base, transforming the client’s raw data and preliminary layout into a visually compelling and informative graphic representation.

Xentag
XenTag is a forward-thinking company based in Toronto, Ontario, that bridges the gap between physical products and digital experiences. Their mission is to help brands drive engagement and improve their bottom line by leveraging their NFC chip technology.
The infographic aimed to highlight how XenTag’s NFC technology can elevate everyday merchandise into exclusive, interactive experiences that engage customers. By incorporating XenTag’s innovative solutions, brands can add a digital layer to their products, boosting customer engagement and transforming merchandise into valuable, collectible items.

Ready to Bring Your Vision to Life?
© 2024-25 Sidra Rehman – All Rights Reserved